Liberation Study Results
Home
About Us
Contact Us
Services
MODSIM™
OPSA™
Publications
People

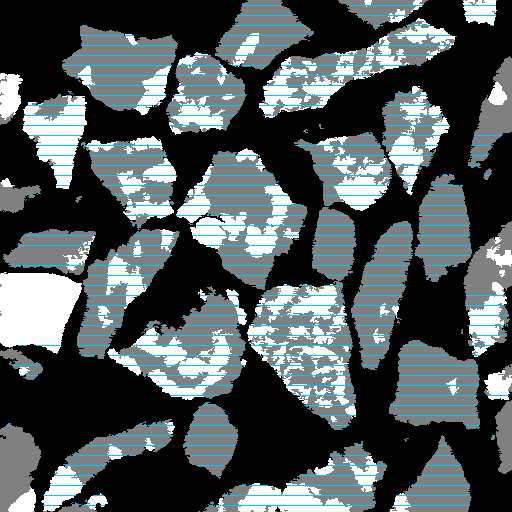
Backscattered-electron image from a cross-section of cobber concentrate from a taconite plant (-710+500 micron size range) showing the measurement of linear grade distribution (blue lines). It can be seen that, in that particular size range, particles are mostly unliberated as the chert (dark grey) and the magnetite (white) are still contained in the same particles.

This shows the variation in "liberation" as a function of particle size for the above cobber concentrate. It can be seen that the coarse particles are contained in a narrow grade range indicating no liberation at all, while as the particle size gets smaller the particle composition spreads out towards grades 0 and 100% illustrating the "liberation process". The so called "liberation size" for this ore is in the region of 100 microns.
how this could apply to your particular ore, contact us.